Q4FY2019 Result Update | Banking
May 03, 2019
Axis Bank
BUY
CMP
`753
Operating performance improves
Target Price
`864
Particulars (` cr)
Q4FY19
Q3FY19
% chg (qoq)
Q4FY18
% chg (yoy)
Investment Period
12 Months
NII
5,706
5,604
1.82
4,730
20.61
Pre-prov. profit
5,014
5,525
-9.24
3,672
36.55
Stock Info
PAT
1,505
1,681
-10.46
-2,189
-
Source: Company, Angel Research
Sector
Banking
For Q4FY2019, Axis Bank reported PAT of `1,505cr driven by healthy NII growth
Market Cap (` cr)
1,97,273
(20.6% yoy), strong traction in fees income (15% yoy), contained Opex (11.1%
Beta
1.2
yoy). Further, higher recoveries & upgrades and lower slippages led to a fall in
52 Week High / Low
788/499
GNPA (declined 151bps yoy & 50bps qoq).
Avg. Daily Volume
3,85,908
Face Value (`)
2
Retail loans drive momentum; NIM improved marginally: During Q4FY2019, the
BSE Sensex
39,032
bank’s advances grew by 13% yoy, with retail and SME growing at 19% yoy and
Nifty
11,035
11.7% yoy respectively. However, overseas book de-grew 29% yoy in Q4FY2019.
Reuters Code
AXBK.BO
Unsecured products such as PL (43% yoy) and cards (49% yoyo) were the primary
Bloomberg Code
AXSB IN
drivers for retail loan book. NIM for the quarter remained flat (3.61%) despite
increased share of higher yielding retail, primarily owing to rising CoF and
decline in C/D. Despite aggressive competition and subdued industry deposit
Shareholding Pattern (%)
growth, bank has been able to grow deposits at 21% yoy. The share of CASA in
Promoters
0.0
the Total Deposits stood at 44%.
MF / Banks / Indian Fls
38.4
Traction noted in fees income: Retail fees grew ~37%/18% yoy/qoq to form
FII / NRIs / OCBs
21.2
~61% of total fees and the share of corporate fees was flat qoq at 14%.
Corporate fees witnessed a declining trend since Q4FY2017, however from last
Indian Public / Others
40..4
two quarter it has moderated.
Slippages moderated; fresh accretion of NPA to be moderate going ahead:
Annualised slippages moderated at 2.4% for Q4FY2019. However, we expect
Abs. (%)
3m 1yr 3yr
fresh accretion of NPA to be lower owing to (1) decline in sub investment book,
Sensex
7.1
12.4
53.4
(2) 82% of corporate exposure to A or better rated and 95% incremental lending
HDFC Bank
15.9
55.1
62.5
to A & better rated corporate, and (3) PCR including technical write-offs at 77%.
Outlook & Valuation: Axis Bank currently trades at 2.2x its FY2021E price to book
3-year price chart
value (after adjusting value of subsidiaries). We expect the stock to get re-rated
900
owing to (1) new leadership, (2) limited stressed loan pool, and (3) improvement
800
700
in return ratios (ROA/ROE - 1.23%/114.7% by FY2020E). We recommend Buy on
600
the stock with a Target Price of `860.
500
400
300
Exhibit 1: Key Financials
Y/E March (` cr)
FY17
FY18
FY19
FY20E
FY21E
NII
18,093
18,618
21,708
25,101
29,149
% chg
7
3
17
16
16
Source: Company, Angel Research
Net profit
3,679
276
4,677
9,269
11,998
% chg
-55
(93)
1,596
98
29
NIM (%)
3.4
3.1
3.2
3.2
3.2
EPS (`)
14
1
18
36
47
P/E (x)
53
701
41
21
16
Jaikishan Parmar
P/ABV (x)
3.6
3.4
3.1
2.6
2.2
Research Analyst
RoA (%)
0.6
0.0
0.6
1.1
1.2
022 - 39357600 Ext: 6810
RoE (%)
7
0
7
13
15
Note: CMP as of 02/05/2019
Please refer to important disclosures at the end of this report
1
Axis Bank|Q4FY2019 Result Update
Exhibit 1: Quarterly Summary
Particular (` Cr)
Q1FY18
Q2FY18
Q3FY18
Q4FY18
Q1FY19
Q2FY19
Q3FY19
Q4FY19
yoy
qoq
Interest Income
11,052
11,235
11,722
11,771
12,777
13,281
14,130
14,798
26
5
Interest Expenses
6,436
6,695
6,990
7,041
7,610
8,049
8,526
9,092
29
7
Net Interest Income (NII)
4,616
4,540
4,732
4,730
5,167
5,232
5,604
5,706
21
2
% Growth YoY
2.2%
0.6%
9.2%
0.0%
11.9%
15.3%
18.4%
20.6%
% Growth QoQ
-2.4%
-1.7%
4.2%
0.0%
9.2%
1.3%
7.1%
1.8%
Other Income
3,000
2,586
2,593
2,789
2,925
2,678
4,001
3,526
26
(12)
Other income as % of TOI
39%
36%
35%
37%
36%
34%
42%
38%
3
(8)
Total Income
14,052
13,821
14,315
14,560
15,702
15,959
18,130
18,324
26
1
Net Income
7,616
7,125
7,325
7,519
8,092
7,910
9,604
9,232
23
(4)
Operating Expenses
3,325
3,348
3,471
3,847
3,720
3,816
4,080
4,217
10
3
Employee Expenses
1,088
1,083
1,063
1,079
1,228
1,175
1,203
1,142
6
(5)
Other Operating Expenses
2,237
2,265
2,408
2,768
2,492
2,642
2,877
3,075
11
7
Cost / Income %
43.7%
47.0%
47.4%
51.2%
46.0%
48.2%
42.5%
45.7%
(5)
3
Operating Profit
4,291
3,777
3,854
3,672
4,372
4,094
5,525
5,014
37
(9)
Provisions
2,342
3,140
2,811
7,180
3,338
2,927
3055
2711
(62)
(11)
PBT
1,949
637
1,043
-3,507
1,034
1,167
2,470
2,303
(166)
(7)
Provisions for Tax
644
205
316
-1,319
333
377
789
798
(161)
1
Tax Rate %
33.0%
32.1%
30.3%
37.6%
32.2%
32.3%
34.0%
34.0%
-
PAT
1,306
432
726
-2,189
701
790
1,681
1,505
(169)
(10)
Profitability
Q1FY18
Q2FY18
Q3FY18
Q4FY18
Q1FY19
Q2FY19
Q3FY19
Q4FY19
bps
bps
Yield Advance
8.7
8.5
8.4
8.1
8.7
8.9
9.1
9.2
104.1
4.7
Yield on Investment
7.1
6.8
7.1
7.0
7.0
7.2
7.3
7.1
12.1
(23.8)
Cost of Fund
4.9
5.0
5.1
4.9
5.1
5.2
5.3
5.3
45.7
4.8
NIM Cal
3.3
3.2
3.2
3.1
3.2
3.2
3.3
3.2
11.5
(12.0)
Spread
3.7
3.5
3.4
3.2
3.7
3.6
3.8
3.8
58.4
(0.1)
NIM Domestic Reported
3.60
3.59
3.50
3.59
3.61
3.61
2.0
-
ROE
0.09
0.03
0.05
-0.14
0.04
0.05
0.10
0.09
22.6
(1.2)
Asset Quality
GNPA%
5.03
5.90
5.28
6.77
6.52
5.96
5.75
5.26
(151)
(49)
NPA%
2.30
3.12
2.56
3.40
3.09
2.54
2.36
2.06
(134)
(30)
PCR Calculated
54
47
52
50
53
57
59
61
1,106
188
Tier - 1
12.60
12.36
14.13
11.68
11.86
11.71
11.77
11.27
(41)
(50)
AT -1
1.36
1.36
1.33
1.30
1.27
(9)
(3)
Tier - 2
4.03
3.96
3.87
3.53
3.49
3.41
3.33
3.30
(23)
(3)
Total
16.6
16.3
18.0
16.6
16.71
16.45
16.40
15.84
(73)
(56)
Source: Company
May 03, 2019
2
Axis Bank|Q4FY2019 Result Update
Exhibit 2: Advances movement
Particular (` cr)
Q1FY18
Q2FY18
Q3FY18
Q4FY18
Q1FY19
Q2FY19
Q3FY19
Q4FY19
yoy%
qoq%
Retail
175278
184256
193295
206464
211648
221710
232397
245812
19
6
Home Loan
77122
79230
81184
82586
84659
86467
90635
93409
13
3
Rural Lending
26292
27638
27061
30970
29631
28822
32536
34414
11
6
Auto Loan
17528
18426
19330
22711
23281
24388
25564
27039
19
6
PL
15775
16583
19330
20646
21165
24388
25564
29497
43
15
LAP
14022
14740
15464
16517
16932
19954
18592
22123
34
19
CC
7011
7370
7732
8259
8466
8868
11620
12291
49
6
SBB
3506
3685
3866
6194
6349
6651
6972
7374
19
6
Other
14022
16583
19330
18582
21165
22171
20916
19665
6
(6)
Corporate Banking
162284
173197
172744
174446
172443
174149
180469
183402
5
2
Term Loan
123909
128049
120700
118418
121948
119520
124698
1,21,122
2
(3)
WC
38375
45148
52674
56028
50495
54629
55771
62,279
11
12
SME
47918
52718
54884
58740
56983
60262
62238
65584
12
5
Term Loan
11124
11725
12170
13264
12348
12496
12846
13,475
2
5
WC
36795
40993
42714
45476
44635
47766
49392
52,109
15
6
Total
385480
410171
420923
439650
441074
456121
475104
494798
13
4
Advance Mix (%)
pbs
pbs
Retail
45.47
44.92
45.92
46.96
47.98
48.61
48.91
49.68
272
76
Home Loan
20.01
19.32
19.29
18.78
19.19
18.96
19.08
18.88
9
(20)
Rural Lending
6.82
6.74
6.43
7.04
6.72
6.32
6.85
6.96
(9)
11
Auto Loan
4.55
4.49
4.59
5.17
5.28
5.35
5.38
5.46
30
8
PL
4.09
4.04
4.59
4.70
4.80
5.35
5.38
5.96
127
58
LAP
3.64
3.59
3.67
3.76
3.84
4.37
3.91
4.47
71
56
CC
1.82
1.80
1.84
1.88
1.92
1.94
2.45
2.48
61
4
SBB
0.91
0.90
0.92
1.41
1.44
1.46
1.47
1.49
8
2
Other
3.64
4.04
4.59
4.23
4.80
4.86
4.40
3.97
(25)
(43)
Corporate Banking
42.10
42.23
41.04
39.68
39.10
38.18
37.99
37.07
(261)
(92)
Term Loan
32.14
31.22
28.68
26.93
27.65
26.20
26.25
24.48
(246)
(177)
WC
9.96
11.01
12.51
12.74
11.45
11.98
11.74
12.59
(16)
85
SME
12.43
12.85
13.04
13.36
12.92
13.21
13.10
13.25
(11)
15
Term Loan
2.89
2.86
2.89
3.02
2.80
2.74
2.70
2.72
(29)
2
WC
9.55
9.99
10.15
10.34
10.12
10.47
10.40
10.53
19
14
Total
100.00
100.00
100.00
100.00
100.00
100.00
100.00
100.00
-
-
Source: Company
May 03, 2019
3
Axis Bank|Q4FY2019 Result Update
Exhibit 3: GNPA Movement, slippages are moderating
Particular (` Cr)
1QFY18
2QFY18
3QFY18
4QFY18
1QFY19
2QFY19
3QFY19
4QFY19
GNPA Opening
21,280
22,031
27,402
25,001
34,249
32,662
30,938
30,855
Fresh Slippage
3,519
8,936
4,428
16,536
4,337
2,777
3,746
3,746
Slippage
0.9%
2.2%
1.1%
3.8%
1.0%
0.6%
0.8%
0.8%
Slippage Annual
3.7%
8.7%
4.2%
15.0%
3.9%
2.4%
3.2%
3.0%
Upgrade & Rec
306
1,048
4,008
3,401
2,917
2,186
1,622
1,622
Write off
2,462
2,517
2,821
3,887
3,007
2,315
2,207
2,207
Closing GNPA
22,031
27,402
25,001
34,249
32,662
30,938
30,855
30,772
Prov
12,265
13,350
13,232
17,657
17,760
18,222
18,622
18,622
NPA
9,766
14,052
11,769
16,592
14,902
12,716
12,233
12,150
Prov
2,342
3,140
2,811
7,180
3,338
2,927
3,055
2,711
CC
0.6%
0.8%
0.7%
1.6%
0.8%
0.6%
0.6%
0.5%
CC Ann
2.4%
3.1%
2.7%
6.5%
3.0%
2.6%
2.6%
2.2%
Source: Company
Exhibit 4: Additional standard asset provisions made in 4QFY2019
Particular
` cr
Provision on non-banking asset (land bank) received through debt resolution process. Residual `1600cr adjusted
540
directly to reserves. This is to be charged to P&L over next 3 quarters
Higher provisions on standard corporate loans rated BB & below and all SMA 2 loans led by adoption of formula
380
driven process for making provisions
Provisions on security receipts (book value ` 2900cr)
220
Higher provision on self identified stressed asset
170
1310
Source: Company
May 03, 2019
4
Axis Bank|Q4FY2019 Result Update
Exhibit 5: SOTP Valuation Summary
Sum of the parts
Stake in Company%
Valuation Methodology
Value/Share `
Core Business
100.0
2.5x FY21E ABV
834.4
Axis Capital Ltd
100
15x FY21E PAT
9.9
Axis MF
75
20x FY21E PAT
3.8
Axis Fin
100
1.5x FY21E BV
10.7
Axis Sec
100
15x FY21E PAT
5.3
Sum of Parts
864.2
Source: Company
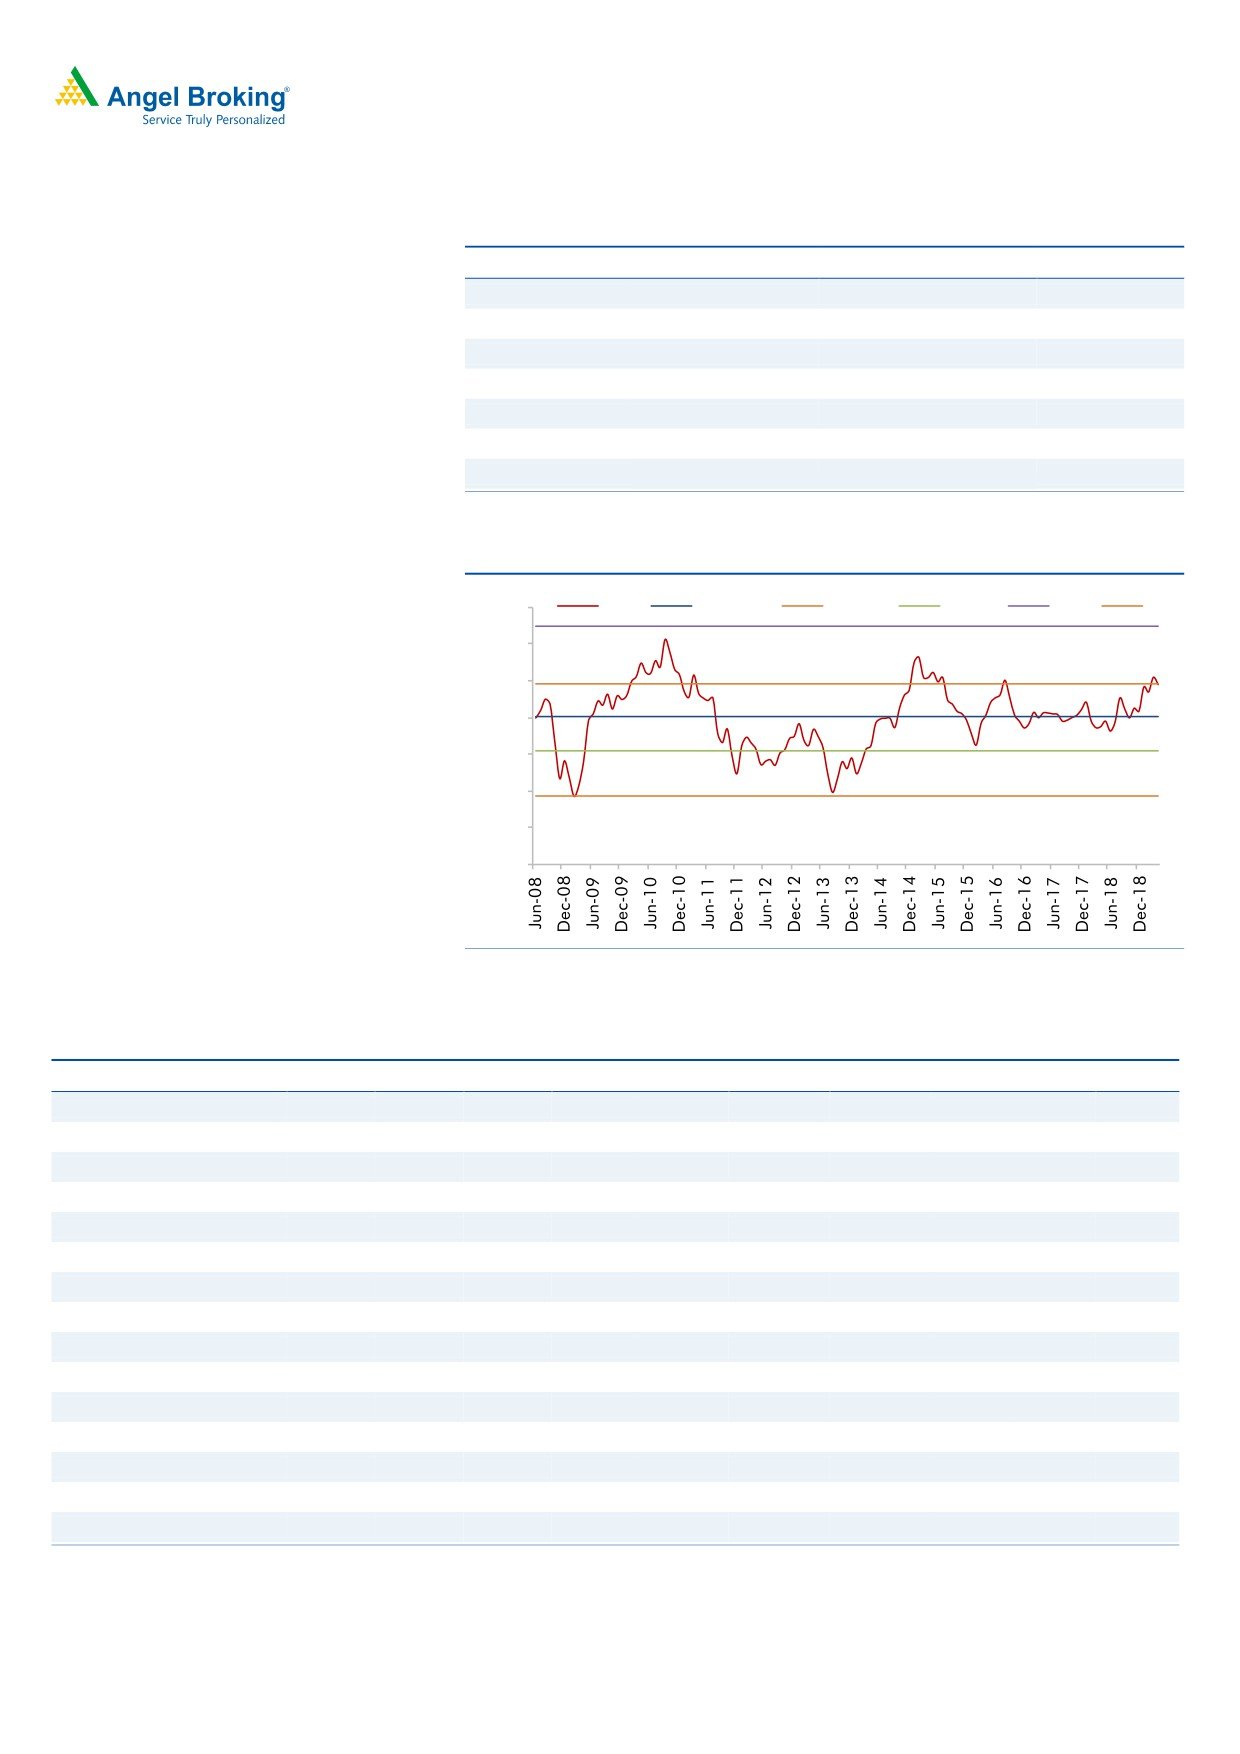
Exhibit 6: 1 year Froward P/ABV Band
3.50
P/BV
Avg. P/BV
+1STD
-1STD
High
Low
3.00
3.25
2.50
2.46
2.00
2.01
1.50
1.55
1.00
0.92
0.50
0.00
Source: Company
Exhibit 7: DuPont Analysis
DuPont Analysis (%)
FY12
FY13
FY14
FY15
FY16
FY17
FY18
FY19
FY20E
FY21E
Interest Income
8.3
8.7
8.5
8.4
8.2
7.8
7.1
7.4
7.6
7.7
Interest Expenses
5.3
5.6
5.2
5.0
4.8
4.6
4.2
4.5
4.6
4.7
NII
3.0
3.1
3.3
3.4
3.4
3.2
2.9
2.9
3.0
3.0
- Prov
0.4
0.6
0.6
0.6
0.7
2.1
2.4
1.6
1.0
0.9
Adj NII
2.6
2.5
2.7
2.8
2.6
1.0
0.5
1.3
2.0
2.1
Other Income
2.1
2.1
2.0
2.0
1.9
2.0
1.7
1.8
1.8
1.8
Total Income
4.7
4.6
4.8
4.8
4.5
3.1
2.2
3.1
3.7
3.9
Opex
2.3
2.2
2.2
2.2
2.0
2.1
2.2
2.1
2.1
2.1
Emp
0.8
0.8
0.7
0.7
0.7
0.7
0.7
0.6
0.6
0.6
Other
1.5
1.4
1.5
1.4
1.3
1.5
1.5
1.5
1.5
1.5
PBT
2.4
2.4
2.6
2.6
2.5
1.0
0.0
0.9
1.7
1.9
TAX
0.8
0.8
0.9
0.9
0.8
0.3
-0.0
0.3
0.6
0.6
RoA
1.6
1.7
1.7
1.7
1.6
0.6
0.0
0.6
1.1
1.23
Leverage
12.6
11.2
10.1
10.2
10.2
10.5
10.8
11.4
11.9
11.9
RoE
20.3
18.5
17.4
17.8
16.8
6.8
0.5
7.2
12.9
14.7
Source: Company
May 03, 2019
5
Axis Bank|Q4FY2019 Result Update
Income Statement
Y/E March (` cr)
FY17
FY18
FY19
FY20E
FY21E
Net Interest Income
18,093
18,618
21,708
25,101
29,149
- YoY Growth (%)
7
3
17
16
16
Other Income
11,691
10,967
13,130
14,884
17,528
- YoY Growth (%)
25
(6)
20
13
18
Operating Income
29,784
29,585
34,839
39,985
46,677
- YoY Growth (%)
14
(1)
18
15
17
Operating Expenses
12,200
13,990
15,833
17,783
20,150
- YoY Growth (%)
21
15
13
12
13
Pre - Provision Profit
17,585
15,594
19,005
22,202
26,527
- YoY Growth (%)
9
(11)
22
17
19
Prov. & Cont.
12,117
15,473
12,031
8,158
8,349
- YoY Growth (%)
227
28
-22
-32
2
Profit Before Tax
5,468
122
6,974
14,044
18,179
- YoY Growth (%)
-56
(98)
5,637
101
29
Prov. for Taxation
1,788
-154
2,297
4,775
6,181
- as a % of PBT
33
-127
33
34
34
PAT
3,679
276
4,677
9,269
11,998
- YoY Growth (%)
(55)
(93)
1,596
98
29
Balance Sheet
Y/E March (` cr)
FY17
FY18
FY19
FY20E
FY21E
Share Capital
479
513
513
513
513
Reserves & Surplus
55,284
62,932
66,676
75,482
86,880
Net Worth
55,763
63,445
67,190
75,995
87,393
Deposits
4,14,379
4,53,623
5,48,471
6,36,227
7,50,748
- Growth (%)
16
9
21
16
18
Borrowings
1,05,031
1,48,016
1,52,776
1,74,164
1,98,547
Other Liab & Prov.
26,387
26,373
28,723
15,684
12,647
Total Liabilities
6,01,559
6,91,458
7,97,160
9,02,070
10,49,335
Cash balances
30,858
35,481
35,099
45,641
46,349
Bank balances
19,398
7,974
32,620
13,110
15,377
Investments
1,28,793
1,53,876
1,74,969
2,00,132
2,28,648
Advances
3,73,069
4,39,650
4,94,798
5,73,966
6,77,279
- Growth (%)
10
18
13
16
18
Fixed Assets
3,747
3,972
4,827
5,599
6,607
Other Assets
45,693
50,505
54,847
63,623
75,075
Total Assets
6,01,559
6,91,458
7,97,160
9,02,070
10,49,335
- Growth (%)
11
15
15
13
16
May 03, 2019
6
Axis Bank|Q4FY2019 Result Update
Key Ratio
Y/E March
FY17
FY18
FY19
FY20E
FY21E
Profitability ratios (%)
NIMs
3.43
3.1
3.16
3.2
3.2
Cost to Income Ratio
41
47
45
44
43
RoA
0.6
0.0
0.6
1.1
1.2
RoE
7
0
7
13
15
B/S ratios (%)
CASA Ratio
51.4
53.8
44.4
44.4
44.4
Credit/Deposit Ratio
90
97
90
90
90
Asset Quality (%)
Gross NPAs
5.04
6.77
5.0
4.0
4.0
Net NPAs
2.11
3.40
2.3
1.7
1.7
Credit Cost
3.2
3.5
2.4
1.4
1.2
Provision Coverage
0.58
0.50
0.54
0.58
0.58
Per Share Data (`)
EPS
14
1
18
36
47
ABVPS (70% cover.)
208
222
246
285
340
DPS
5
5
5
5
5
Valuation Ratios
PER (x)
53
701
41
21
16
P/ABVPS (x)
3.6
3.4
3.1
2.6
2.2
Dividend Yield (%)
0.7
0.7
0.7
0.7
0.7
DuPont Analysis
FY17
FY18
FY19E
FY20E
FY21E
Interest Income
7.8
7.1
7.4
7.6
7.7
Interest Expenses
4.6
4.2
4.5
4.6
4.7
NII
3.2
2.9
2.9
3.0
3.0
- Prov
2.1
2.4
1.6
1.0
0.9
Adj NII
1.0
0.5
1.3
2.0
2.1
Other Income
2.0
1.7
1.8
1.8
1.8
Total Income
3.1
2.2
3.1
3.7
3.9
Opex
2.1
2.2
2.1
2.1
2.1
PBT
1.0
0.0
0.9
1.7
1.9
TAX
0.3
-0.0
0.3
0.6
0.6
RoA
0.6
0.0
0.6
1.1
1.23
Leverage
10.5
10.8
11.4
11.9
11.9
RoE
6.8
0.5
7.2
12.9
14.7
Valuation done on closing price of 02/05/2019
May 03, 2019
7
Axis Bank|Q4FY2019 Result Update
Research Team Tel: 022 - 39357800
DISCLAIMER
Angel Broking Limited (hereinafter referred to as “Angel”) is a registered Member of National Stock Exchange of India Limited, Bombay
Stock Exchange Limited, Metropolitan Stock Exchange Limited, Multi Commodity Exchange of India Ltd and National Commodity &
Derivatives Exchange Ltd It is also registered as a Depository Participant with CDSL and Portfolio Manager and Investment Adviser with
SEBI. It also has registration with AMFI as a Mutual Fund Distributor. Angel Broking Limited is a registered entity with SEBI for Research
Analyst in terms of SEBI (Research Analyst) Regulations, 2014 vide registration number INH000000164. Angel or its associates has not
been debarred/ suspended by SEBI or any other regulatory authority for accessing /dealing in securities Market. Angel or its
associates/analyst has not received any compensation / managed or co-managed public offering of securities of the company covered
by Analyst during the past twelve months.
This document is solely for the personal information of the recipient, and must not be singularly used as the basis of any investment
decision. Nothing in this document should be construed as investment or financial advice. Each recipient of this document should
make such investigations as they deem necessary to arrive at an independent evaluation of an investment in the securities of the
companies referred to in this document (including the merits and risks involved), and should consult their own advisors to determine
the merits and risks of such an investment.
Reports based on technical and derivative analysis center on studying charts of a stock's price movement, outstanding positions and
trading volume, as opposed to focusing on a company's fundamentals and, as such, may not match with a report on a company's
fundamentals. Investors are advised to refer the Fundamental and Technical Research Reports available on our website to evaluate the
contrary view, if any
The information in this document has been printed on the basis of publicly available information, internal data and other reliable
sources believed to be true, but we do not represent that it is accurate or complete and it should not be relied on as such, as this
document is for general guidance only. Angel Broking Limited or any of its affiliates/ group companies shall not be in any way
responsible for any loss or damage that may arise to any person from any inadvertent error in the information contained in this report.
Angel Broking Limited has not independently verified all the information contained within this document. Accordingly, we cannot testify,
nor make any representation or warranty, express or implied, to the accuracy, contents or data contained within this document. While
Angel Broking Limited endeavors to update on a reasonable basis the information discussed in this material, there may be regulatory,
compliance, or other reasons that prevent us from doing so.
This document is being supplied to you solely for your information, and its contents, information or data may not be reproduced,
redistributed or passed on, directly or indirectly.
Neither Angel Broking Limited, nor its directors, employees or affiliates shall be liable for any loss or damage that may arise from or in
connection with the use of this information.
Disclosure of Interest Statement
Axis Bank
1. Financial interest of research analyst or Angel or his Associate or his relative
No
2. Ownership of 1% or more of the stock by research analyst or Angel or associates or relatives
No
3. Served as an officer, director or employee of the company covered under Research
No
4. Broking relationship with company covered under Research
No
Ratings (Based on expected returns
Buy (> 15%)
Accumulate (5% to 15%)
Neutral (-5 to 5%)
over 12 months investment period):
Reduce (-5% to -15%)
Sell (< -15)
May 03, 2019
8